[Graphics]PIX on UE5 Notes
keywords: Graphics, PIX, Profiling, GPU Capture, Wave Distribution, UE5 Shader Debugging
GPU Frame Capture
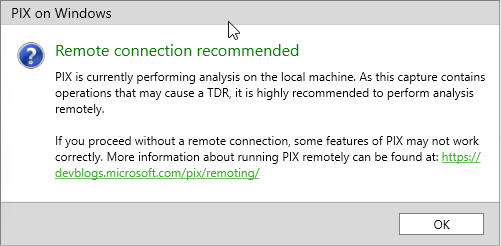
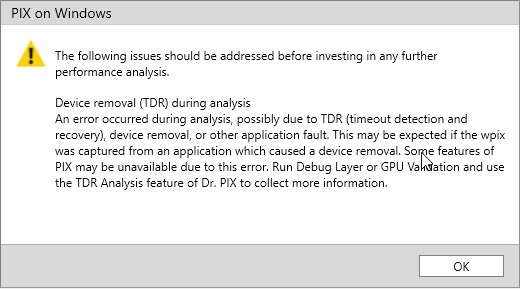
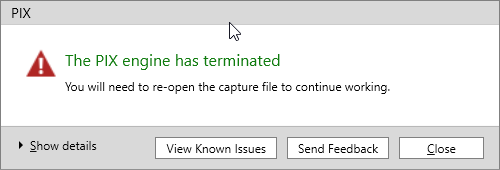
If capture GPU Frame from the PIX GUI on local machine, even if the TDR detection has been turned off, sometimes (depended on GPU driver) PIX GUI may crash while parsing data. PIX recommends analysising remotely.
To address this issue on local machine, you should do profiling using programmatic API.
Steps:
Replace the line PIXBeginCapture2() with PIXGpuCaptureNextFrames() since the output file (*.wpix) can’t be open (cause a crash when parsing the data):
PIXGpuCaptureNextFrames(TEXT("E:/pixtest.wpix"), 1);
Then build game in Development, and start game with argument:
MyGame.exe -attachPIX -d3ddebug
Then run command pix.GpuCaptureFrame in console at runtime, after a while of hitching, finally the data file will be outputed in directory E:/.
Open it and start analysising. Overview of result:
Dispatching diagram between Async Compute Queue and Graphics Queue:
Wave Intrinsics (Wavefront):
There’s a switch named r.D3D12.AutoAttachPIX in UE5/Engine/Config/ConsoleVariables.ini, it’s just used for profiling from programmatic API, not PIX GUI.
Shader Debugging in PIX
1, Edit Engine/Config/ConsoleVariables.ini and uncomment follows:
; Uncomment to get detailed logs on shader compiles and the opportunity to retry on errors
r.ShaderDevelopmentMode=1

; Uncomment when running with a graphical debugger (but not when profiling)
r.Shaders.Optimize=0
; When this is enabled, shaders will have extra debugging info. This could change patch sizes, uniqueness, etc and will recompile the shaders
r.Shaders.Symbols=1
; When this is enabled, ShaderName field of FRHIShader will be populated (Development and Debug builds only)
r.Shaders.ExtraData=1
; Uncomment to skip shader compression. Can save a significant time when using debug shaders.
r.Shaders.SkipCompression=1
2, Disable IoStore: Project Settings -> Packaging -> Uncheck Use Io Store.
3, Build package in Development mode.
Make sure there is enough space on memory, requires at least 128GB of RAM, since the building for shader debugging consumes huge memory that much more than normal building.
The shader source files (bytecode packaged for HLSL) output path (SM6 example) which will be packed into pak:
MyGame\Saved\Shaders\PCD3D_SM6-PCD3D_SM6\ShaderCode-MyGame-PCD3D_SM6-PCD3D_SM6.ushaderbytecode
MyGame\Saved\Shaders\PCD3D_SM6-PCD3D_SM6\ShaderCode-Global-PCD3D_SM6-PCD3D_SM6.ushaderbytecode
4, Catpure GPU frame in PIX (start game with argument: -d3ddebug).
5, Start analysis, and select target marker (GPU validation event) in the Pipeline view.
6, Select target buffer or texture, then pick the target pixel.
7, Then click Debug Pixel.
8, After a while hitching, you can enter the process of shader debugging, hit F11 to step into function, hit F10 to step over.
References:
GPU – Debugging Shaders - dev.epicgames.com
Shader Debugging Workflows - dev.epicgames.com
GPU Timing Capture
//
//  timing capture
//
PIXCaptureParameters captureParams = {};

captureParams.TimingCaptureParameters.CaptureGpuTiming = TRUE;
captureParams.TimingCaptureParameters.CaptureCallstacks = TRUE;
captureParams.TimingCaptureParameters.CaptureCpuSamples = TRUE;
captureParams.TimingCaptureParameters.CpuSamplesPerSecond = 4000;

captureParams.TimingCaptureParameters.CaptureStorage = PIXCaptureParameters::Memory;
captureParams.TimingCaptureParameters.FileName = wstrFilename;
captureParams.TimingCaptureParameters.MaximumToolingMemorySizeMb = 4096;

XSF_ERROR_IF_FAILED(PIXBeginCapture(PIX_CAPTURE_TIMING, &captureParams));
Origin: Timing Capture
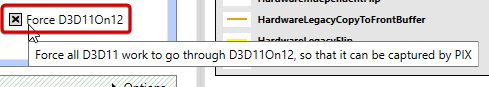
How to capture GPU Frame for D3D11
By default PIX can’t capture GPU Frame on DirectX 11, so how to address this issue?
Solution:
Check Force D3D11On12.
References
GPU Captures (Recommended)
https://devblogs.microsoft.com/pix/gpu-captures/
Hardware Counters in GPU Captures
https://devblogs.microsoft.com/pix/hardware-counters-in-gpu-captures/
Occupancy explained (AMD RGP Limiters Graph)
https://gpuopen.com/learn/occupancy-explained/
Optimizing GPU occupancy and resource usage with large thread groups
https://gpuopen.com/learn/optimizing-gpu-occupancy-resource-usage-large-thread-groups/
Learning is like rowing upstream: not to advance is to drop back. -Chinese Proverbs