keywords: Windows Debugging Tools, Whitout PDB file, Crash, Dump file, Linux Core Dump, GDB debug
WinDbg (On Windows)
Motivation
PDB containes tons of informations on debugging (such as source line, symbol names), in order to prevent application from being cracked easily, we usually don’t keep PDB files while publishing application. But it would cause that function name turned into memory address in callstack of crash, thus we can’t address to source line while application crashed. So, is there any way to address source line with PDB files removed?
Open WinDbg, set symbol file and open binary file. e.g.:
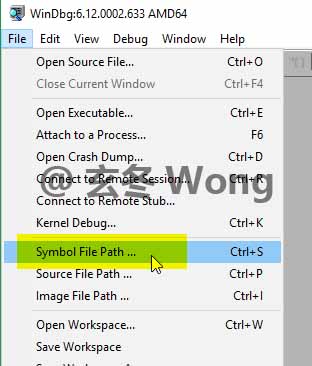
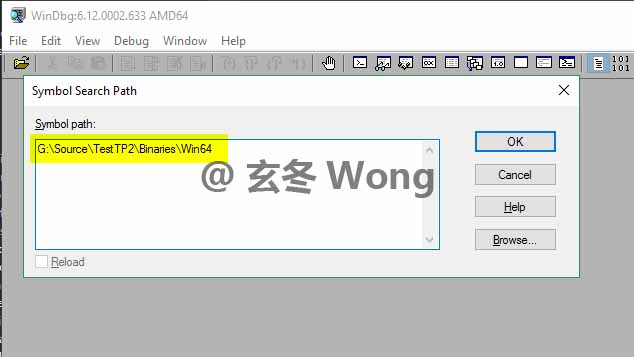
set symbol file directory
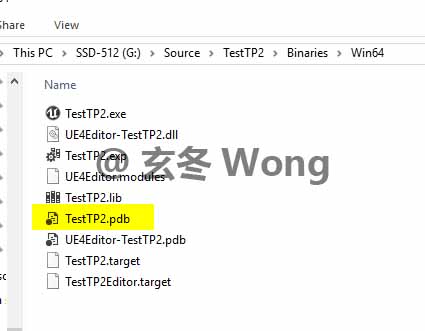
then WinDbg would search symbol file in this directory:
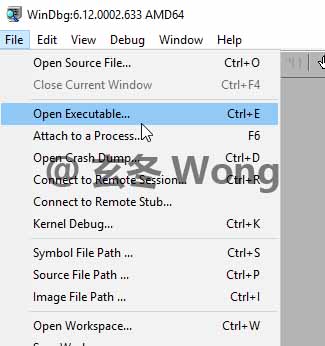
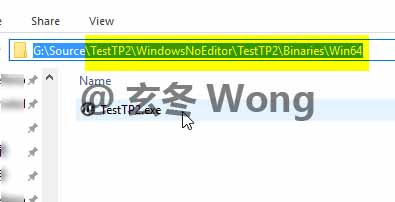
Open Executable file:
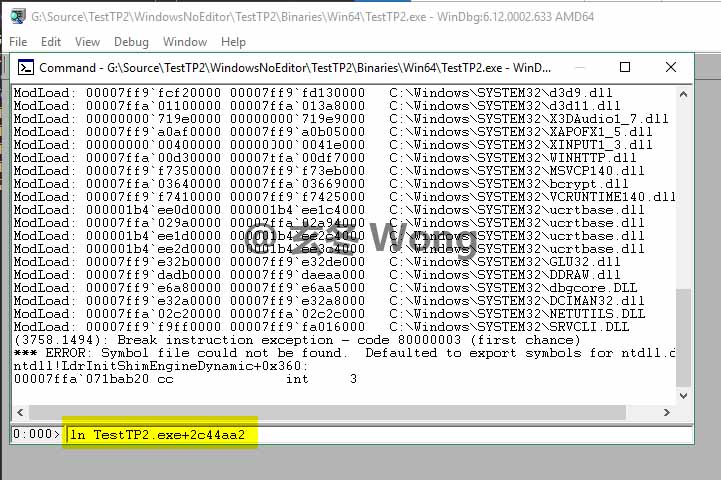
Execute command to address source line. e.g.
ln TestTP2.exe+2c44aa2
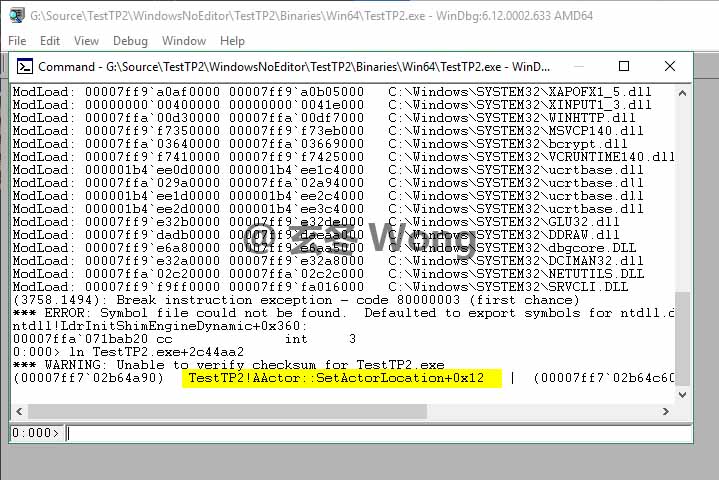
then would output the source line. In there, because SetActorLocation is the source of engine, and we didn’t set the symbol file directory of engine binary, so it didn’t display the engine source line.
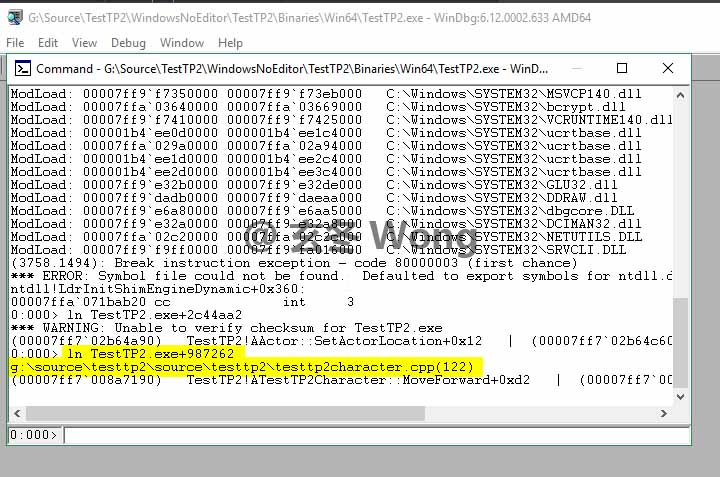
then we search the last address, we can find ourself source, and display the source file path and line
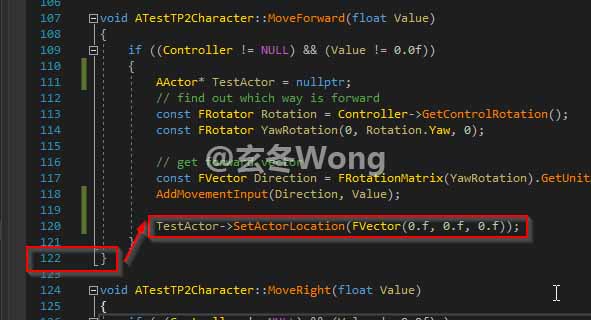
5. Finally we can locate place where application crashed at: the line above the display line
Note: the line displayed in WinDbg isn’t the exact place where cause a crash, the real line cause the crash is above it.
If application crashed without dump generation on progression of development, we can address source line using Visual Studio.
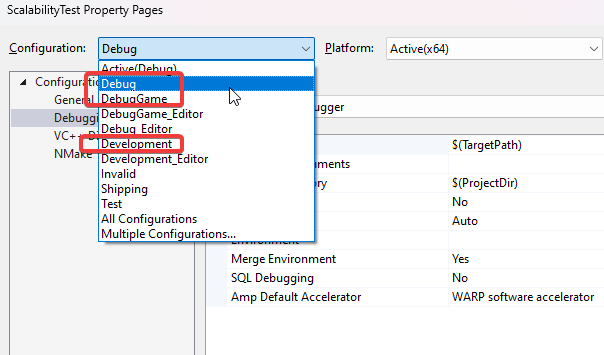
Open your cpp project using Visual Studio, click menu Debug -> MyGame Debug Properties, switch Configuration to Debug:
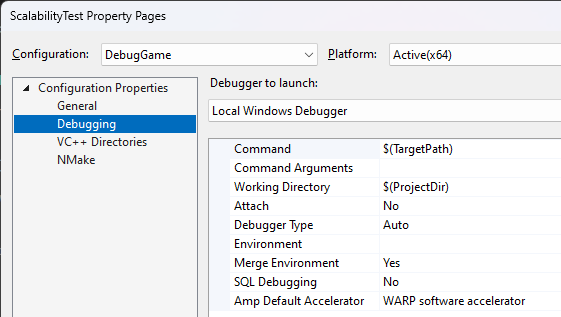
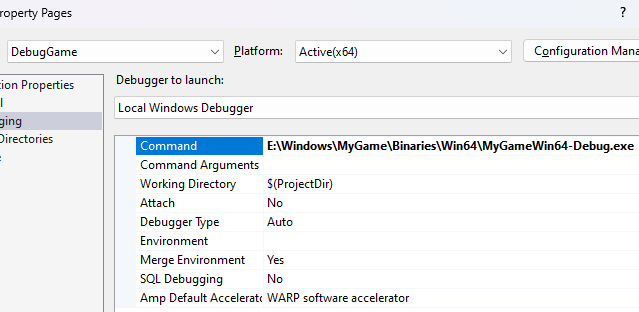
and modify Configuration Properties -> Debugging, set Command as the path of executable file of your application.
Default:
Modified:
Then startup debugging (F5), then you would get callstack with source line when you application crashed.
If your project is based on Unreal Engine, you should clean Command Arguments, or set it as an unmeaning string, (default is: "$(SolutionDir)Rouge.uproject" -skipcompile) otherwise you will get error on startup: ICU data directory was not discovered.