[Graphics]Profiling Tools Notes
keywords: Graphics, RGP, NSight, RenderDoc, Snapdragon, AGI, PIX, Tracing, Profiling, Monitoring, Sighting, Capture, Android, MIUI, iOS, Mobile, Debug
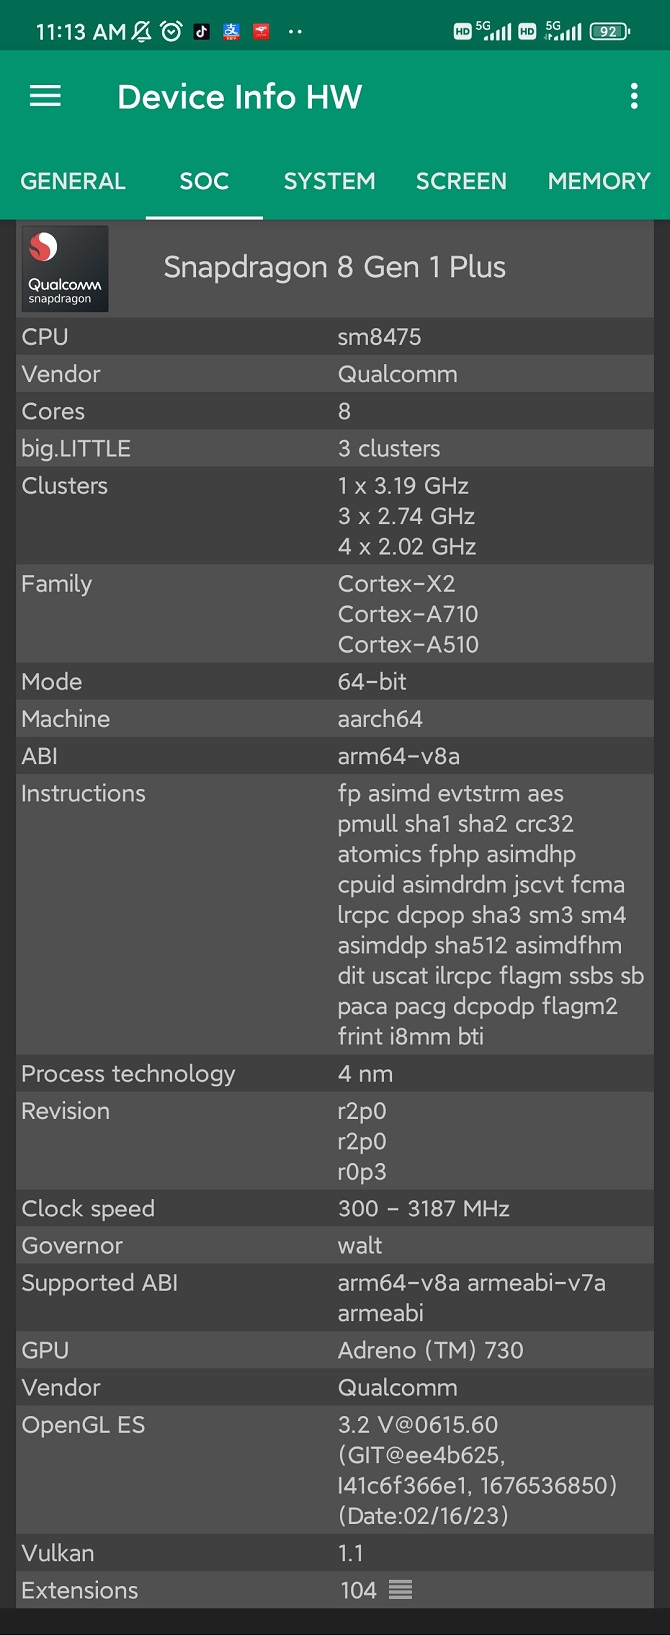
How to check supported OpenGL ES version and Vulkan version on Android device
Download Device Info HW from Google Play, open it and switch to soc tab.
How to capture GPU frame for Android UE5 game in Snapdragon Profiler
1, Enable USB debug and GPU debug on Android device:
2, Build Android package using OpenGL ES in UE5 editor settings.
The recommended method is to build using Test mode, and enable ALLOW_PROFILEGPU_IN_TEST in Build.cs.
Profiling tools can’t capture GPU data for Vulkan backend games built without Vulkan validation layer (also named Debug Vulkan layer) libs
3, Startup Snapdragon Profiler and click Start a Session.
4, Connect device.
5, Switch Layout to OpenGL, if can’t see OpenGL option, maybe the GPU debugging has been disabled.
Even you turn GPU debugging on, device may turn GPU debugging off automatically for saving performance, so you need to enable it again manually.
6, Click Snapshot GPU Frame Capture.
7, Click Launch to open game.
Finally, capture GPU frame successfully.
How to install Vulkan validation layer for Android device in UE5?
- Check the NDK version you installed:
- Download Vulkan validation layer on official site:Vulkan-ValidationLayers for Android.
Then extract libs into directory: %NDKROOT%/sources/third_party/vulkan/src/build-android/jni/ - Project Settings -> Platforms -> Android -> Debug Vulkan Layer Directory, locate to the directory that Vulkan validation layers lib installed.
- Add validation layer name
VK_LAYER_KHRONOS_validationinDebug Vulkan Device Layers:
You must build Development package for Vulkan profiling since Vulkan validation layer has been excluded in Shipping mode.
How to check the dispatch count (calls)
RGP: Overview -> Frame summary -> Event Statistics -> Dispatch
RenderDoc: Window -> Statistics Viewer -> Dispatch calls
NSight: (in GPU Trace Profiler) Metrics -> Dispatch Started
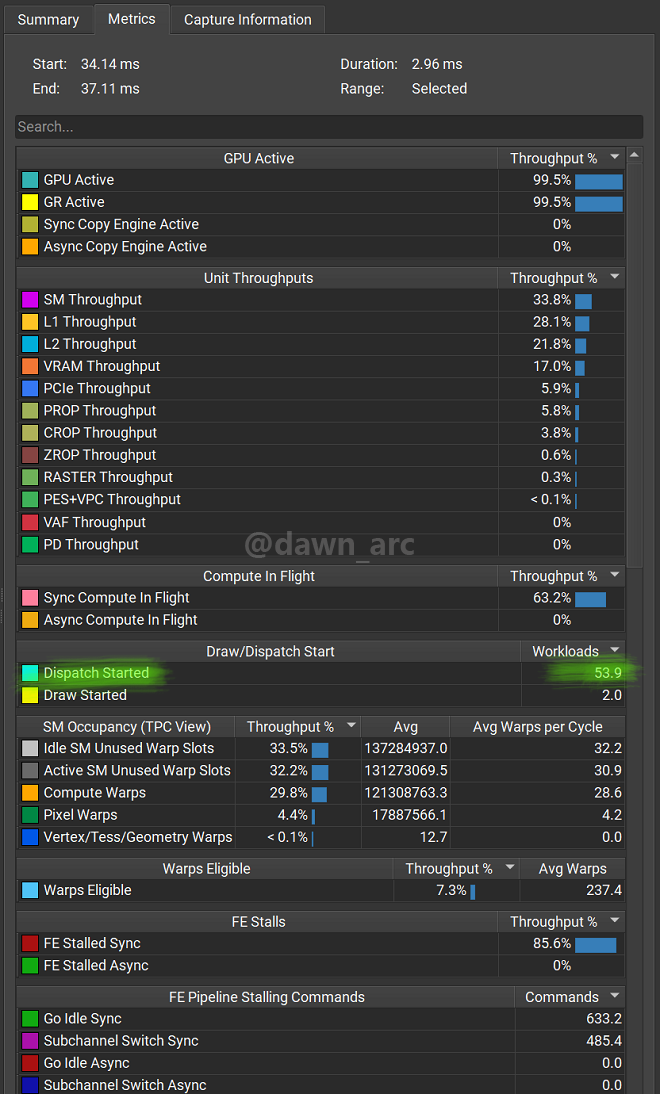
Dispatch Started is the ratio of current dispatch count to the maximum dispatch count. See the Nsight profiling specifications.
PIX: (These two parameters just for Nvidia, not AMD)
How to debug D3D12 (run Debug Layer or GPU Validation) in RenderDoc for UE5 games
1, Build package in Development.
2, Disable TDR detection:
KeyPath   : HKEY_LOCAL_MACHINE\System\CurrentControlSet\Control\GraphicsDrivers
KeyValue  : TdrLevel
ValueType : REG_DWORD
ValueData : 0
Need to reboot device to take effect.
3, Append -d3ddebug in arguments to initialize a device with the debug layer enabled.
At this time, there will be a prompt in the top-left corner of the screen: Profiling with debug device ON!
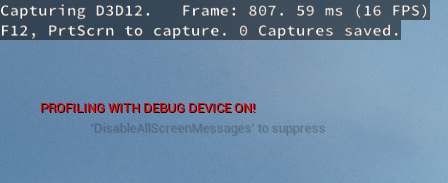
-gpuvalidation or -d3d12gpuvalidation only enables GPU Validation, but does not enable Debug Layer, and gpuvalidation may cause games under AMD graphics cards to crash.
Result:
How to debug D3D12 (run Debug Layer or GPU Validation) in PIX for UE5 games
1, Build package in Development.
2, Disable TDR detection and reboot device.
The latest PIX will disable TDR detection automatically when you capture GPU frame at first time.
3, Append -d3ddebug in arguments to initialize a device with the debug layer enabled.
4, Start Analysis (Ctrl + F5).
Result:
References:
Testing and debugging TDR during driver development - learn.microsoft.com
Graphics diagnostics tools - learn.microsoft.com
If capture GPU Frame from PIX GUI on local machine, even if TDR detection is turned off, sometimes PIX GUI may crash while parsing data. PIX recommends analysising remotely.
To address this issue, you should do profiling using programmatic API, for more details, see: PIX on UE5 Notes
Enable RGP Frame Markers in UE5
D:\UE5\Engine\Config\ConsoleVariables.ini
; Uncomment to enable frame markers in D3D12 for the Radeon GPU Profiler (RGP)
; (Vulkan will auto-enable frame markers for RGP, but in D3D12, they have to be enabled manually for now.)
D3D12.EmitRgpFrameMarkers=1
r.AsyncPipelineCompile=0
Frame Marker is similar to SCOPED_NAMED_EVENT of the CPU, which is used to capture timing on the GPU, but need to insert code manually.
Fortunately, UE5 has already inserted these codes in Development mode.
If want to integrate PIX Event (likes RGP Frame Marker) in UE5, see: WinPixEventRuntime
How to measure GPU performance from scratch (without benchmark)
Start a query, upload a large buffer, and when you get the query back you can measure the time delta.
Origin: Is there any way to get the count of TMU and ROP of GPU at run-time? - reddit
Hardware (GPU) Information
Check GPU API (OpenGL, D3D, Vulkan) extentions
https://gfxbench.com/result.jsp
C++ Library for pulling system and hardware information, without hitting the command line.
https://github.com/ThePhD/infoware
Home of the community driven hardware databases for Khronos APIs.
https://gpuinfo.org/
GPU Specs Database
https://www.techpowerup.com/gpu-specs/
Debugging & Profiling
Orbit & Dive: C/C++ Performance Profiler (both for CPU and GPU)
https://github.com/google/orbit
The RAD Debugger is a native, user-mode, multi-process, graphical debugger.
https://github.com/EpicGames/raddebugger
Dig the well before you are thirsty. -Chinese Proverbs