[UE4]Program Debugging Tricks Notes
Keywords: UE4, Programming Debug Tricks, Insights, Memory, Tracking, Profiling, Performance Optimization
UE_LOG Related
Shipping 版本开启log
添加以下到 Target.cs 的构造函数中(Editor.Target.cs不需要添加):
BuildEnvironment = TargetBuildEnvironment.Unique;
bUseLoggingInShipping = true;
log文件生成位置
- 客户端log:
%localappdata%\<ProjectName>\Saved\Logs; - 服务端log:
WindowsServer\<ProjectName>\Saved\Logs;bUseLoggingInShipping = true;只对源码编译的引擎版本有效,Launcher版本无效。Launcher版本无法在Shipping模式下开启log。
VisualStudio中查看UE4 log
如果要查看VS命令行的UE4相关log,需要Debug模式(VS的Debug,即F5,不是UE4的DebugGame)Android Device Monitor 打印log
比如UE4工程的C++代码中有如下log打印语句:
UE_LOG(LogTemp, Display, TEXT("aaaaaaa"));
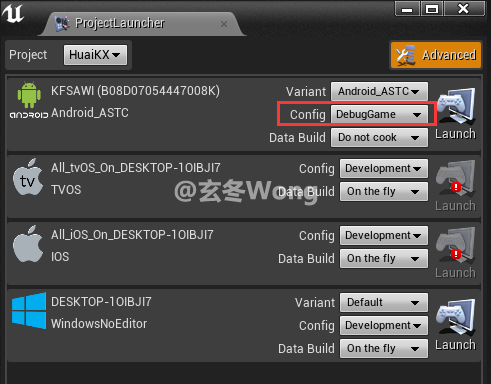
我们希望这句话在Android Device Monitor中能也能够打印出来,默认情况下,需要在将设备的Config设置为DebugGame或者Development,Shipping下则不会打印。

Android Device Monitor中显示的游戏UE_LOG,统一都是Debug级别的蓝色,即使是UE_LOG的级别为Error,显示的也是蓝色。
Useful API
How to debug inline function?
Use FORCEINLINE_DEBUGGABLE.
Example:
from Engine\Source\Runtime\RHI\Public\RHICommandList.h:
FORCEINLINE_DEBUGGABLE void CopyTexture(FRHITexture* SourceTextureRHI, FRHITexture* DestTextureRHI, const FRHICopyTextureInfo& CopyInfo)
{
}
Setup:
Modify “Engine\Source\Runtime\Core\Public\Misc\CoreMiscDefines.h”:
Origin:
#if UE_BUILD_DEBUG
    #define FORCEINLINE_DEBUGGABLE FORCEINLINE_DEBUGGABLE_ACTUAL
#else
    #define FORCEINLINE_DEBUGGABLE FORCEINLINE
#endif
New:
#if UE_BUILD_DEBUG
    #define FORCEINLINE_DEBUGGABLE FORCEINLINE_DEBUGGABLE_ACTUAL
#else
    #if UE_BUILD_DEVELOPMENT
        #define FORCEINLINE_DEBUGGABLE FORCEINLINE_DEBUGGABLE_ACTUAL
    #else
        #define FORCEINLINE_DEBUGGABLE FORCEINLINE
    #endif
#endif
UE5: Disable code optimization for source block
UE_DISABLE_OPTIMIZATION

AMyActor::TestFun()
{
}

UE_ENABLE_OPTIMIZATION
How to print log in low level
FPlatformMisc::LowLevelOutputDebugStringf(TEXT("FWebBrowserTextureResource:CopySample 11"));
Trace & Insight
How to record tracing data for Insights
cpp code:
void UCharacterMovementComponent::TickComponent(float DeltaTime, enum ELevelTick TickType, FActorComponentTickFunction *ThisTickFunction)
{
    SCOPED_NAMED_EVENT(UCharacterMovementComponent_TickComponent, FColor::Yellow);
    SCOPE_CYCLE_COUNTER(STAT_CharacterMovement);
    SCOPE_CYCLE_COUNTER(STAT_CharacterMovementTick);
    CSV_SCOPED_TIMING_STAT_EXCLUSIVE(CharacterMovement);
    ...
}
Then start Engine\Binaries\Win64\Engine\Binaries\Win64\UnrealInsights.exe, then start application using CMD appending arguments:
MyGame.exe -trace=default,counters -statnamedevents
Profiling for remoted Insights:
TestServer.exe -tracehost=`your ip`
Q: How to enable Insights on Linux?
A: Add PLATFORM_LINUX in Engine\Source\Runtime\TraceLog\Public\Trace\Config.h.
SCOPE_CYCLE_COUNTER Usage
Take STAT_CharacterMovement for example:
- Declare your Stat firstly (for more details, see: UE4\Engine\Source\Runtime\Engine\Public\EngineStats.h):
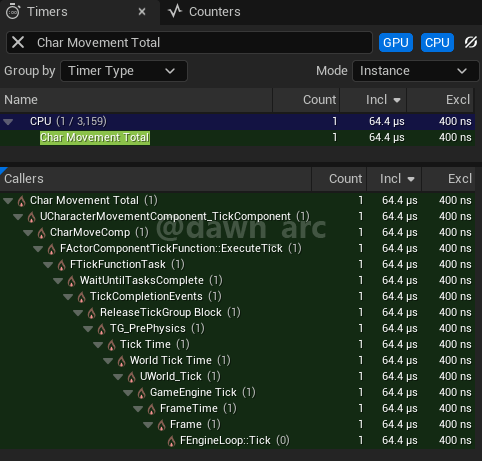
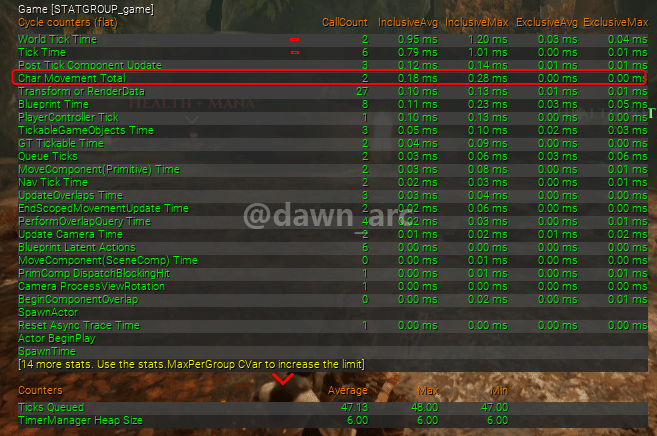
DECLARE_CYCLE_STAT_EXTERN(TEXT("Char Movement Total"), STAT_CharacterMovement, STATGROUP_Game, );STATGROUP_Gamemeans you can capture this counter using commandstat game.
You can also add your customized stat command, such asSTATGROUP_MYTEST. - Then add your Stat in your game source (see: CharacterMovementComponent.cpp):
void UCharacterMovementComponent::TickComponent() { SCOPE_CYCLE_COUNTER(STAT_CharacterMovement); ... } - Then profiling your game using Insights, flag
countersmust be appended.MyGame.exe -trace=default,counters - Finally, you can view the counter in Insights.

You can also capture the counter from console command: stat game.

References:
https://blog.csdn.net/qq_29523119/article/details/123606732
https://blog.csdn.net/wmy19890322/article/details/131944569
How to print call stack in log
FDebug::DumpStackTraceToLog()
Origin: How to print callstack into log ?
https://answers.unrealengine.com/questions/446990/how-to-print-callstack-into-log.html
How to use Insights on Android
Using Insights on Android (UE4.24 or later)
https://qiita.com/EGJ-Takashi_Suzuki/items/4d586d73556995e3dd40
How to print performance issues log
Add define LOOKING_FOR_PERF_ISSUES.
Memory Profiling
Memory Optimization (Not recommended)
MallocLeakReporter Setup:
-
Add mactro in
[Project].Target.cs:GlobalDefinitions.Add("MALLOC_LEAKDETECTION=1"); -
Ensure
bIncludeDebugFile=TRUEin Project Settings. -
Create a package with
Development. -
Execute command at runtime:
 mallocleak.start // Start tracing
 mallocleak.report // Get leak report
 mallocleak.stop // End of trace
MallocLeakReporter isn’t accurate, it’s just a reference.
MallocLeakReporter (MALLOC_LEAKDETECTION)
https://qiita.com/donbutsu17/items/7258955cbb458c1256c9
Debugging and Optimizing Memory
https://www.unrealengine.com/en-US/blog/debugging-and-optimizing-memory
Address Sanitizer (ASan)
modify Engine/Source/Program/UnrealBuildTool/Platform/<platform name>/UEBuild<platform name>.cs:
bEnableAddressSanitizer = true;
This option is usable on Linux and Mac only.
Reference: Enable Address Sanitizer in [UE4] and check for memory corruption
https://qiita.com/com04/items/feadbdc5651c1ffcf36a
Documents - Optimizing Memory
Debugging and Optimizing Memory
https://www.unrealengine.com/en-US/blog/debugging-and-optimizing-memory
Efficiency is doing the thing right. Effectiveness is doing the right thing. ― Peter F. Drucker